chapter 8
Dashboards (after Tufte)
- 8.1 Principles mapped to rules
- 8.2 The dashboard as a document
- 8.3 What the owner dashboard measures
- 8.4 Never
8.1 Principles mapped to rules
| Principle | Rule here |
|---|---|
| Data-ink | No card backgrounds beyond one hairline; no gridlines unless a value is read from them |
| Chartjunk | No icons in charts, no gradients, no 3D, no gauges or donuts |
| Lie factor | Bars start at zero; the promise line is drawn at its true value |
| Small multiples | One small chart per technician rather than one chart with many colours |
| Words, numbers, pictures together | Chart titles state the finding; values are labelled on the marks |
| Integrity | Every panel names its unit, period, source and basis; sample data is labelled |
| Comparisons | Each figure sits beside what it should be (the 60-minute promise) |
| Content over interface | Filters are shown as text chips; no decorative chrome |
8.2 The dashboard as a document
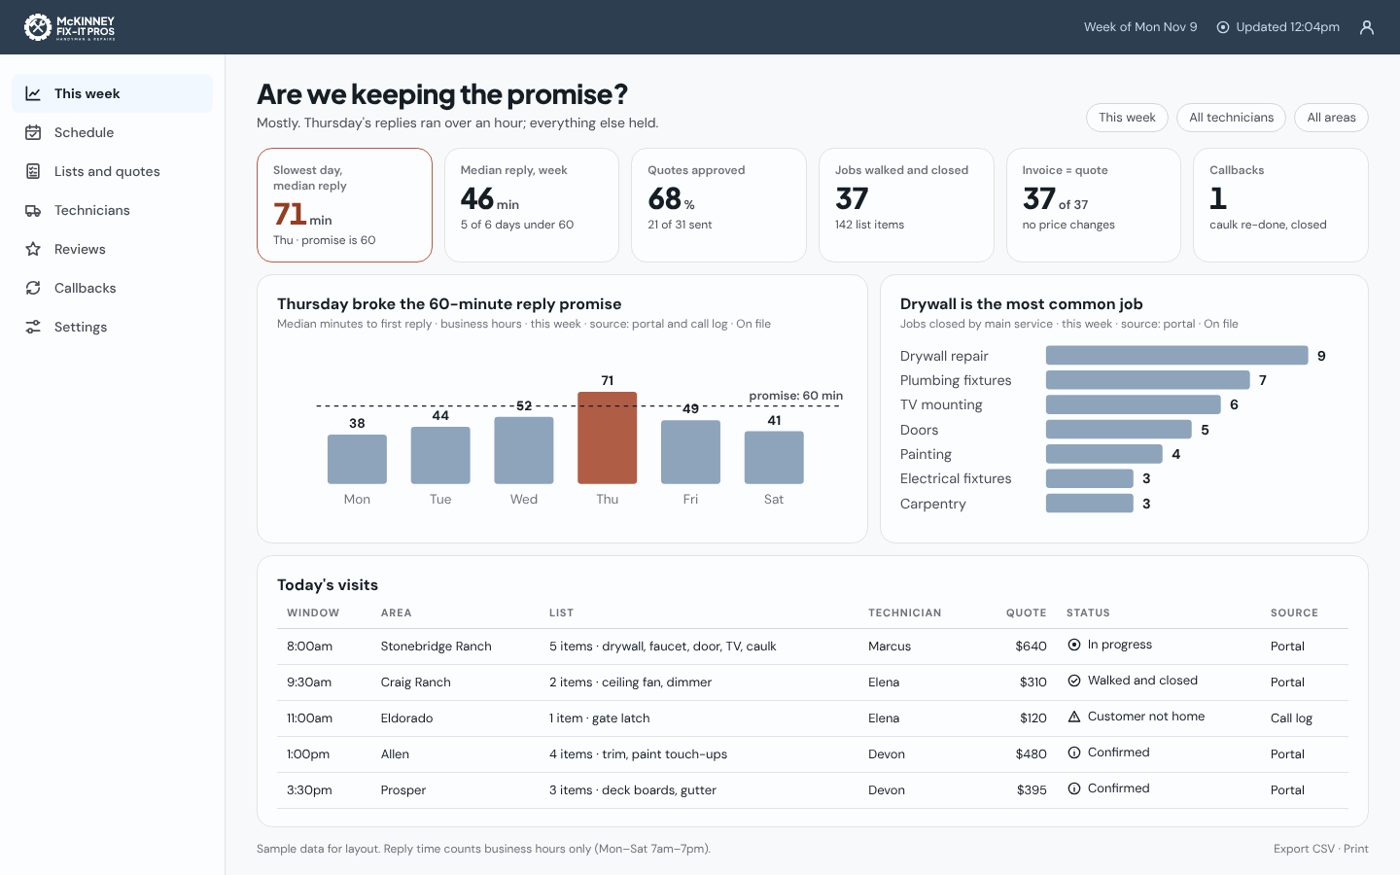
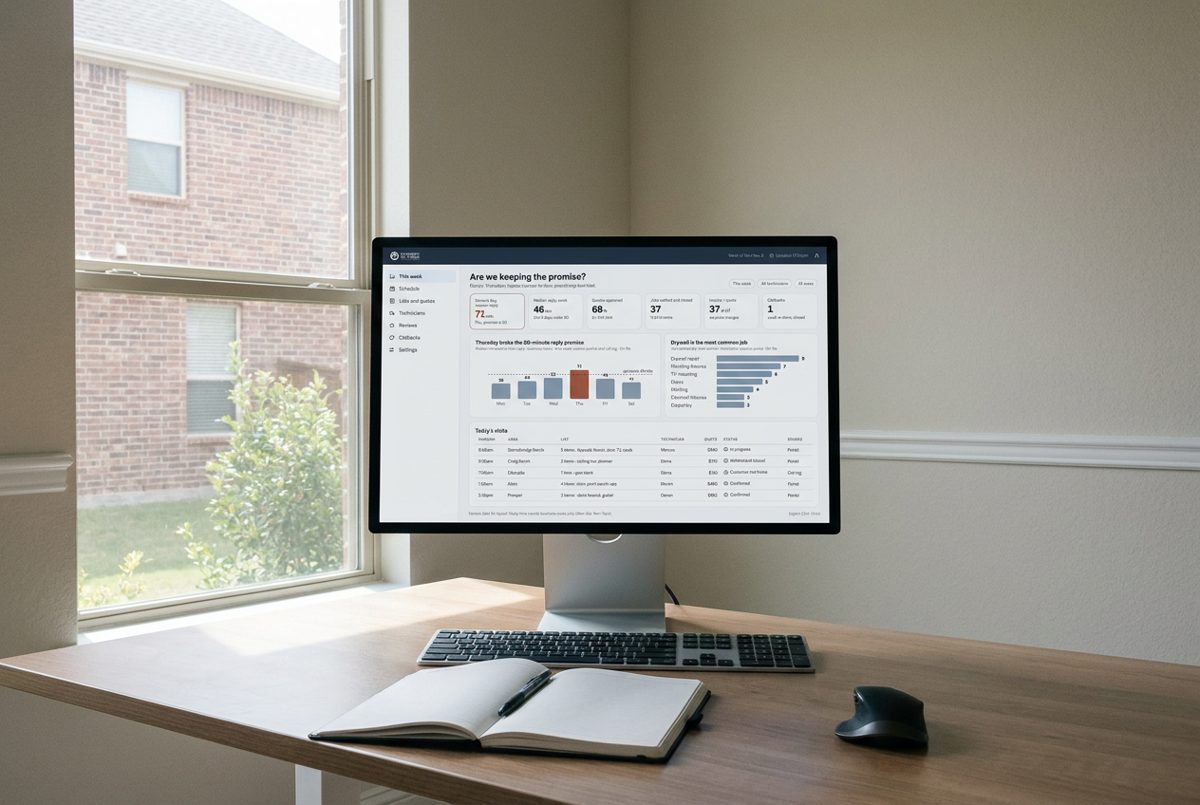
Title as a question ("Are we keeping the promise?") and a one-sentence answer → filter chips → verdict strip of six stat cards with exactly one terracotta finding → two evidence charts → today's visits table with a Source column → footer with definitions, freshness and export.
8.3 What the owner dashboard measures
These are the brand's units turned into numbers: median minutes to first reply (business hours), quotes approved, jobs walked and closed, invoices equal to quote, callbacks. Reply time counts Monday to Saturday, 7am–7pm only.
8.4 Never
Gauges, donuts, dual axes, traffic lights without a word and an icon, a number without unit and source, animation on charts, a second terracotta element.